Understanding Seismic Site Effects
What is site effect ?
The input motion that arrives at the surface of the Earth is affected by the nature of the seismic source, the Earth’s material that it is traveling through (medium) and the underground geology beneath the surface. Site effect is the influence of the underground geological structure at the seismic motion while it approaches the Earth’s surface. That alters greatly the characteristics of the seismic ground motion such as the amplitude of the waveform, the frequency distribution, and the duration of the shaking. In addition, site effect can greatly amplify the magnitude of the seismic motion often by nearly two orders of magnitude or more. Hence, it demands diligent consideration.
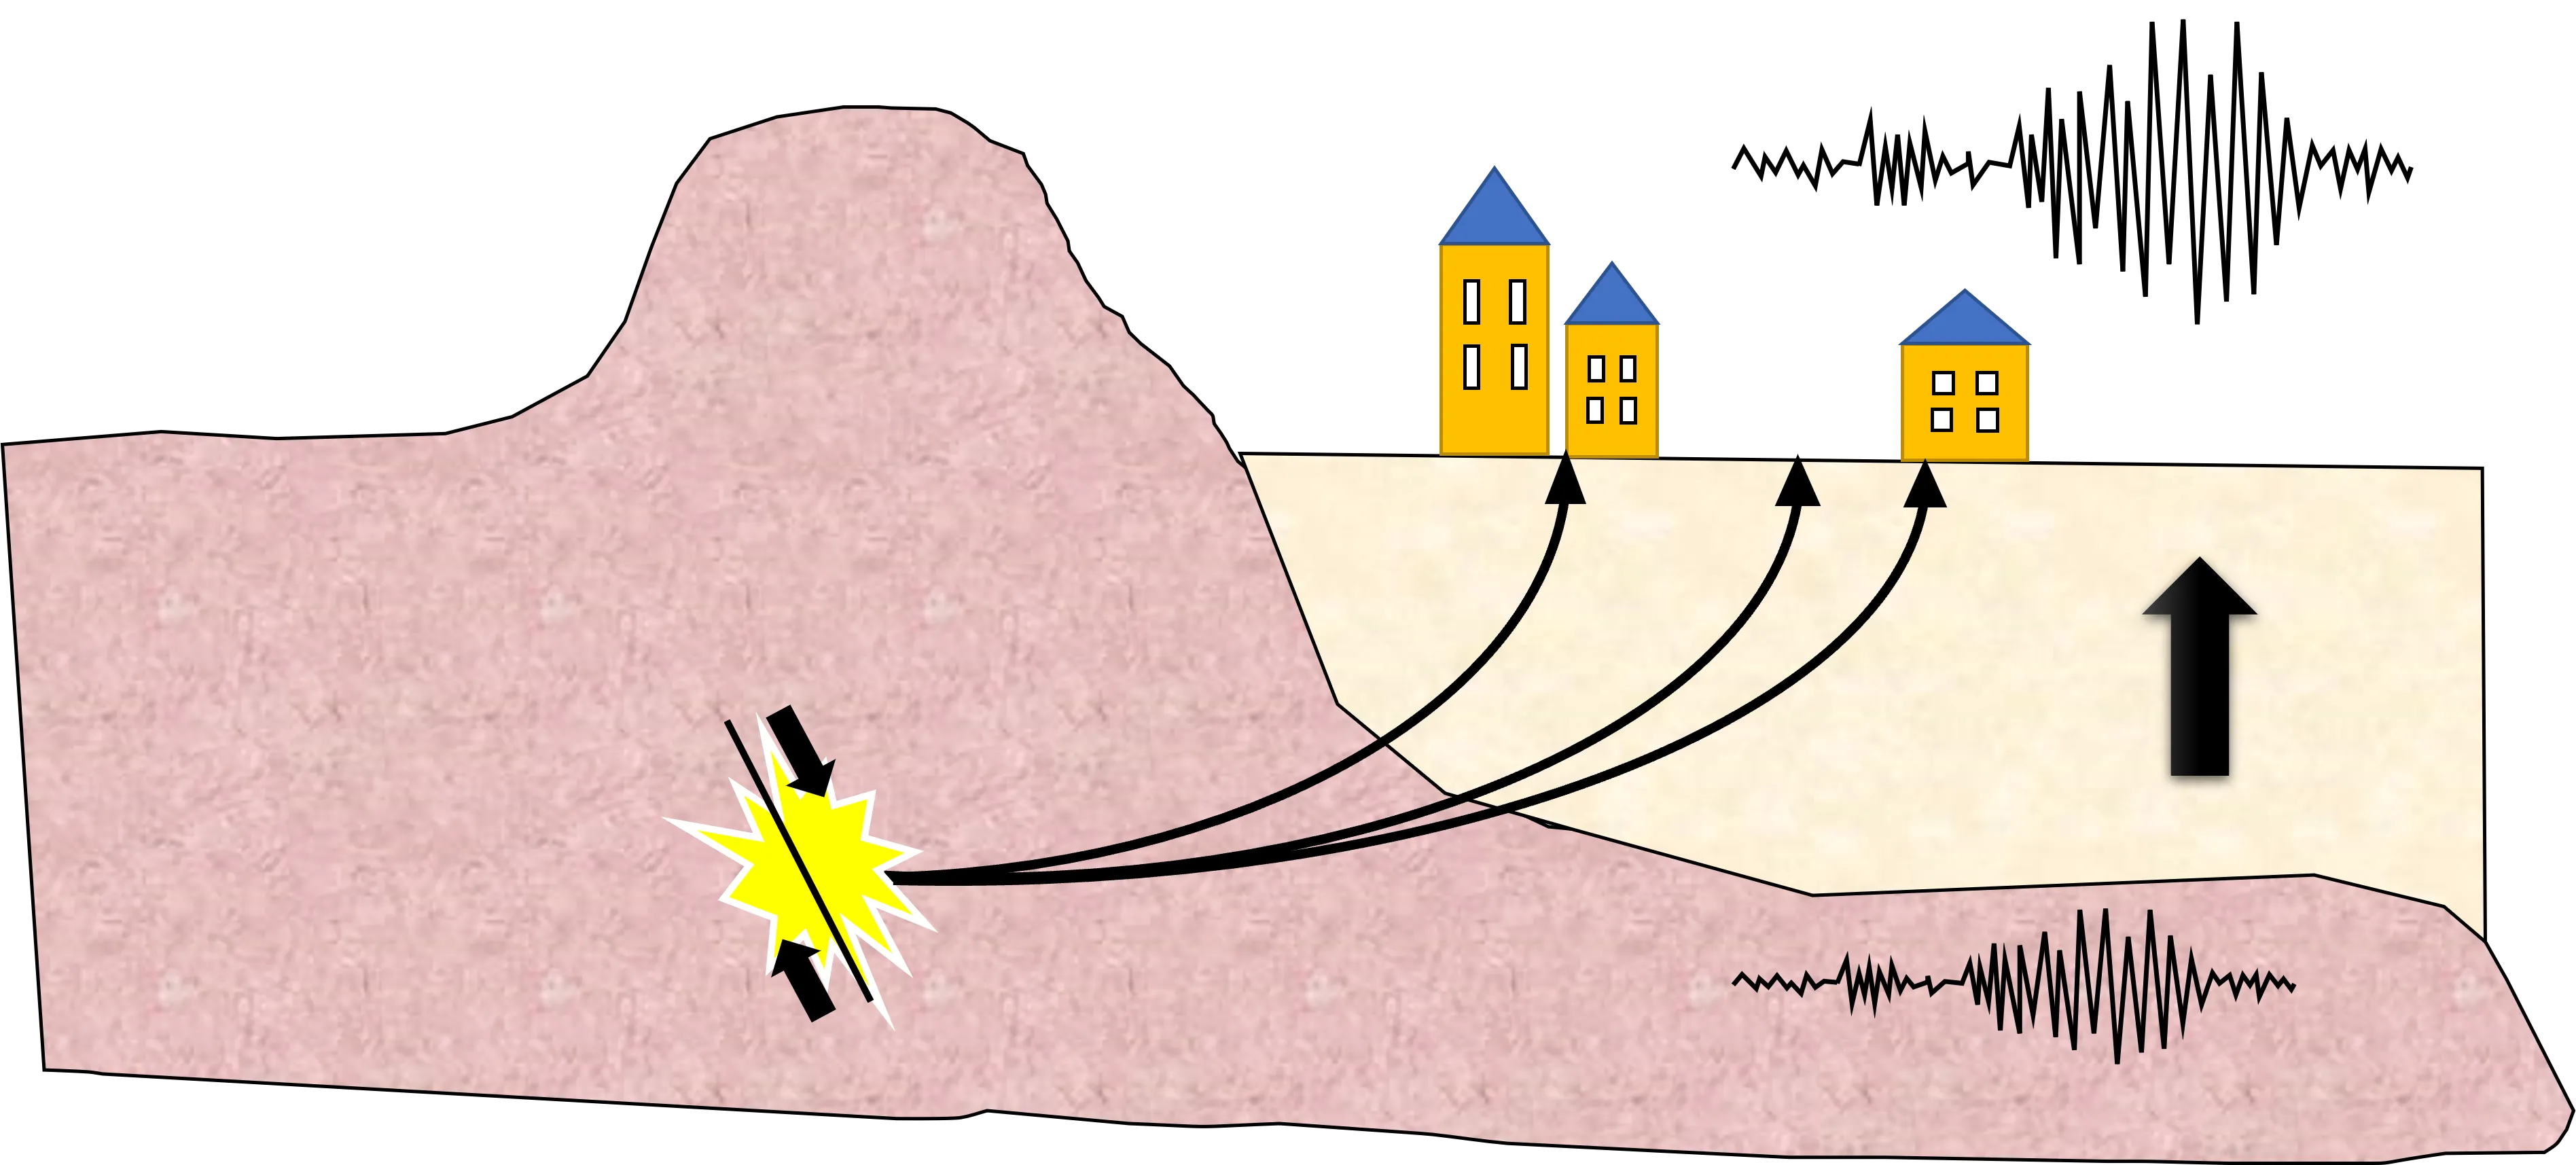 Site effect, the amplification of the ground motion due to the underground Geology
Local Site Conditions Effect
Input motion can be influenced by various geological conditions beneath a site. These conditions include a range of physical processes, including multiple reflections and diffractions of trapped ground motion due to the geometry of underlying structure, deep sedimentary basins below the site, topographic irregularities, the softness of the soil etc. The following effects can greatly influence the strong ground motion at a site.
Softness of the Underground Material
The elastic properties of the Earth’s materials ranges from hard rock materials to soft sediments. Seismic waves travel faster through hard rocks than through softer rocks and sediments. As the waves pass from deep, hard rocks to shallow and soft sediments they slow down and get bigger in amplitude due to the conservation of energy and as a result amplify the ground motion. Just like tsunamis, that they get bigger while they approach the coast (decrease of depth). The softer the rock or soil under a site is, the larger the wave.
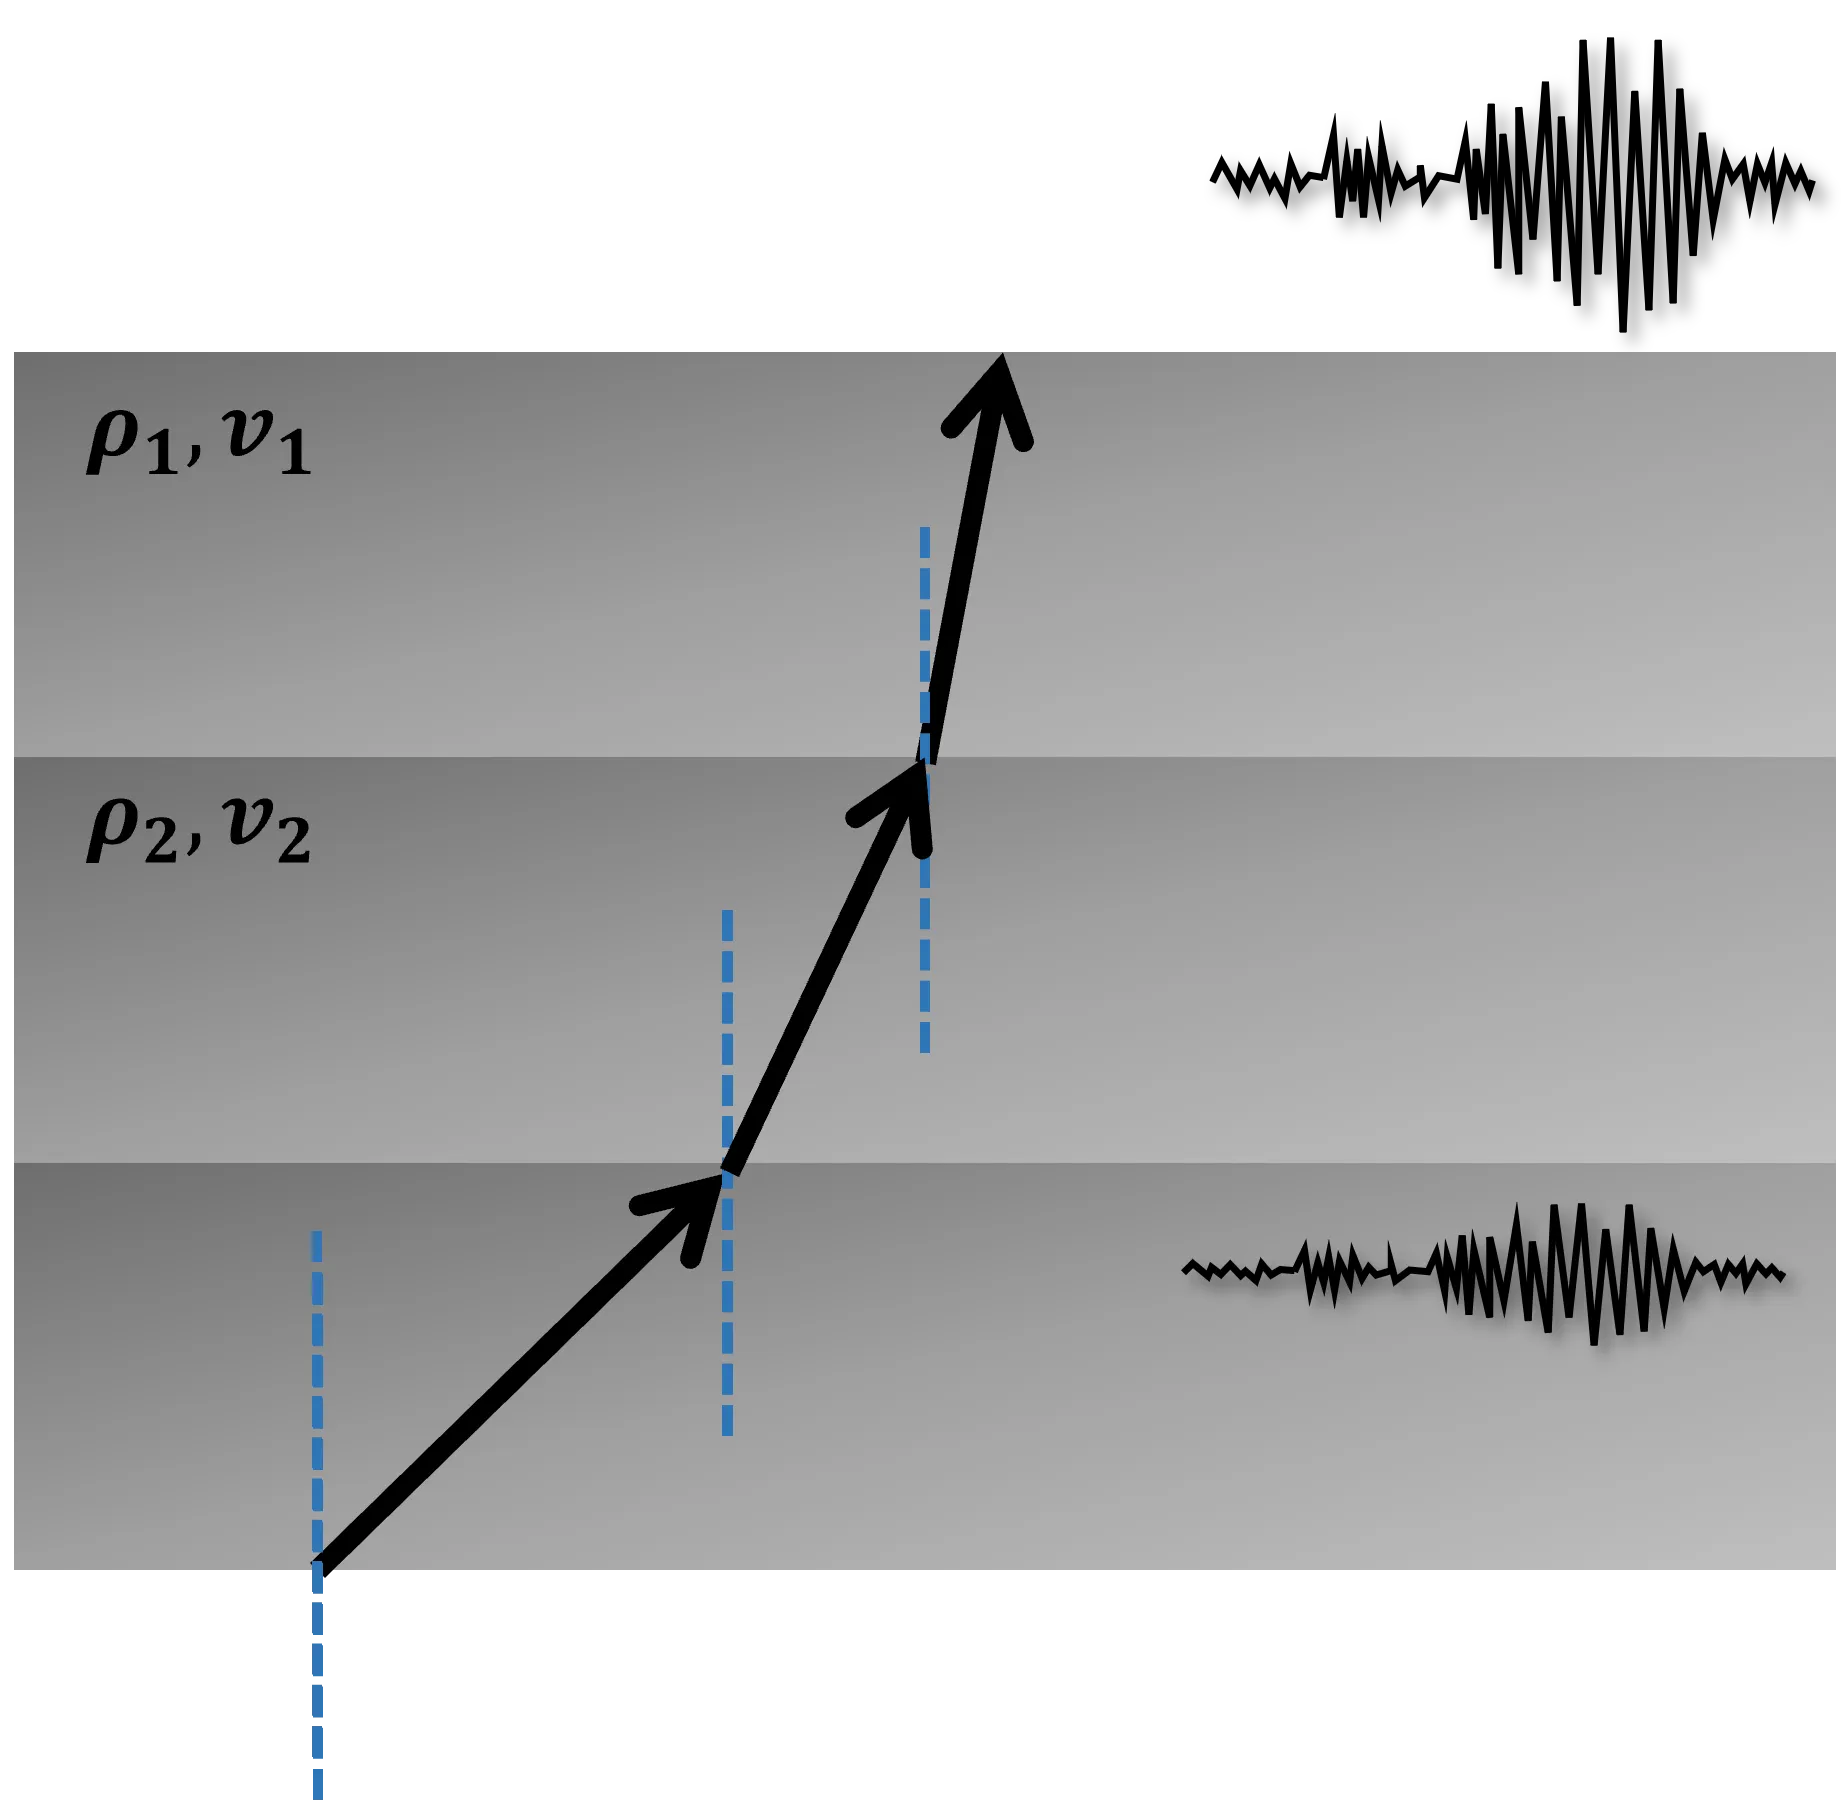 Elastic properties of the underground medium below the surface. The input motion travels towards surface layers with lower velocity and density that results in higher amplitudes at the surface due to the conservation of energy
Geological Basins
The curvature of a basin in which softer alluvial soils have been deposited can trap body waves and cause some incident body waves to propagate through the alluvium as surface waves. These waves can produce stronger shaking and longer durations.
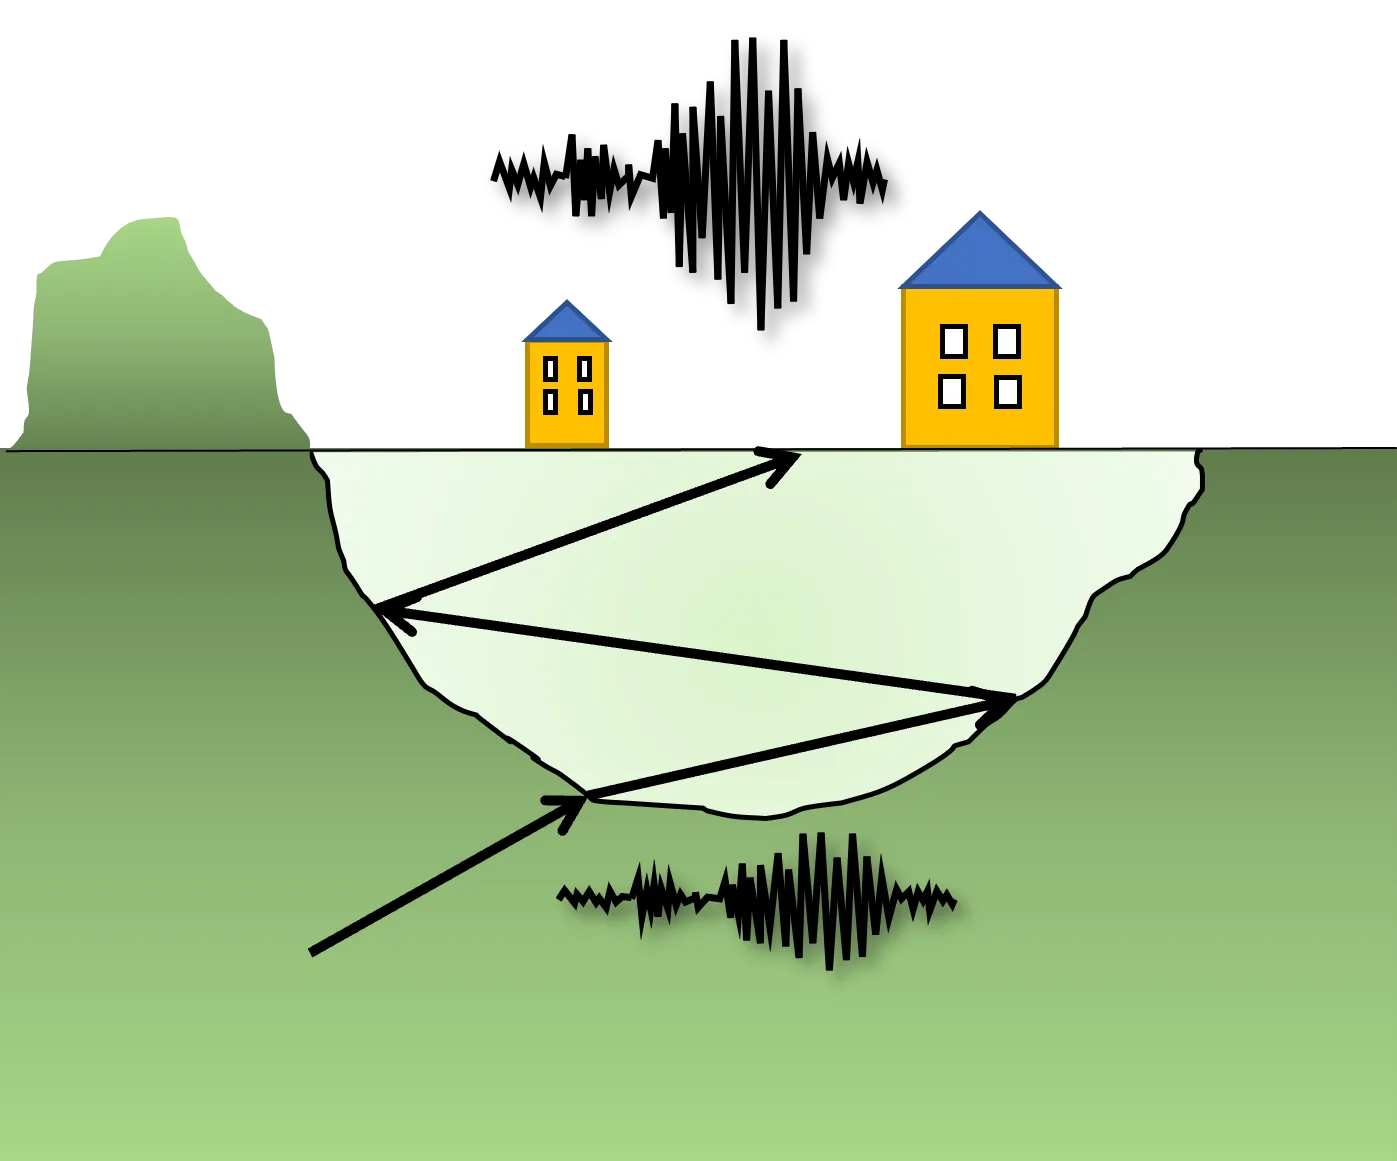 Underground basin geometry affects the ground motion characteristics. Multiple reflections can greatly increase the amplitude of the motion at the surface due to the conversion of body waves to surface waves
Topographic Irregularities
The interaction of waves can produce complex patterns of amplification and deamplification depending on the geometry of the irregularity (triangular wedges, troughs, crests) and on the types, frequencies and angles of incidence of the incoming waves.
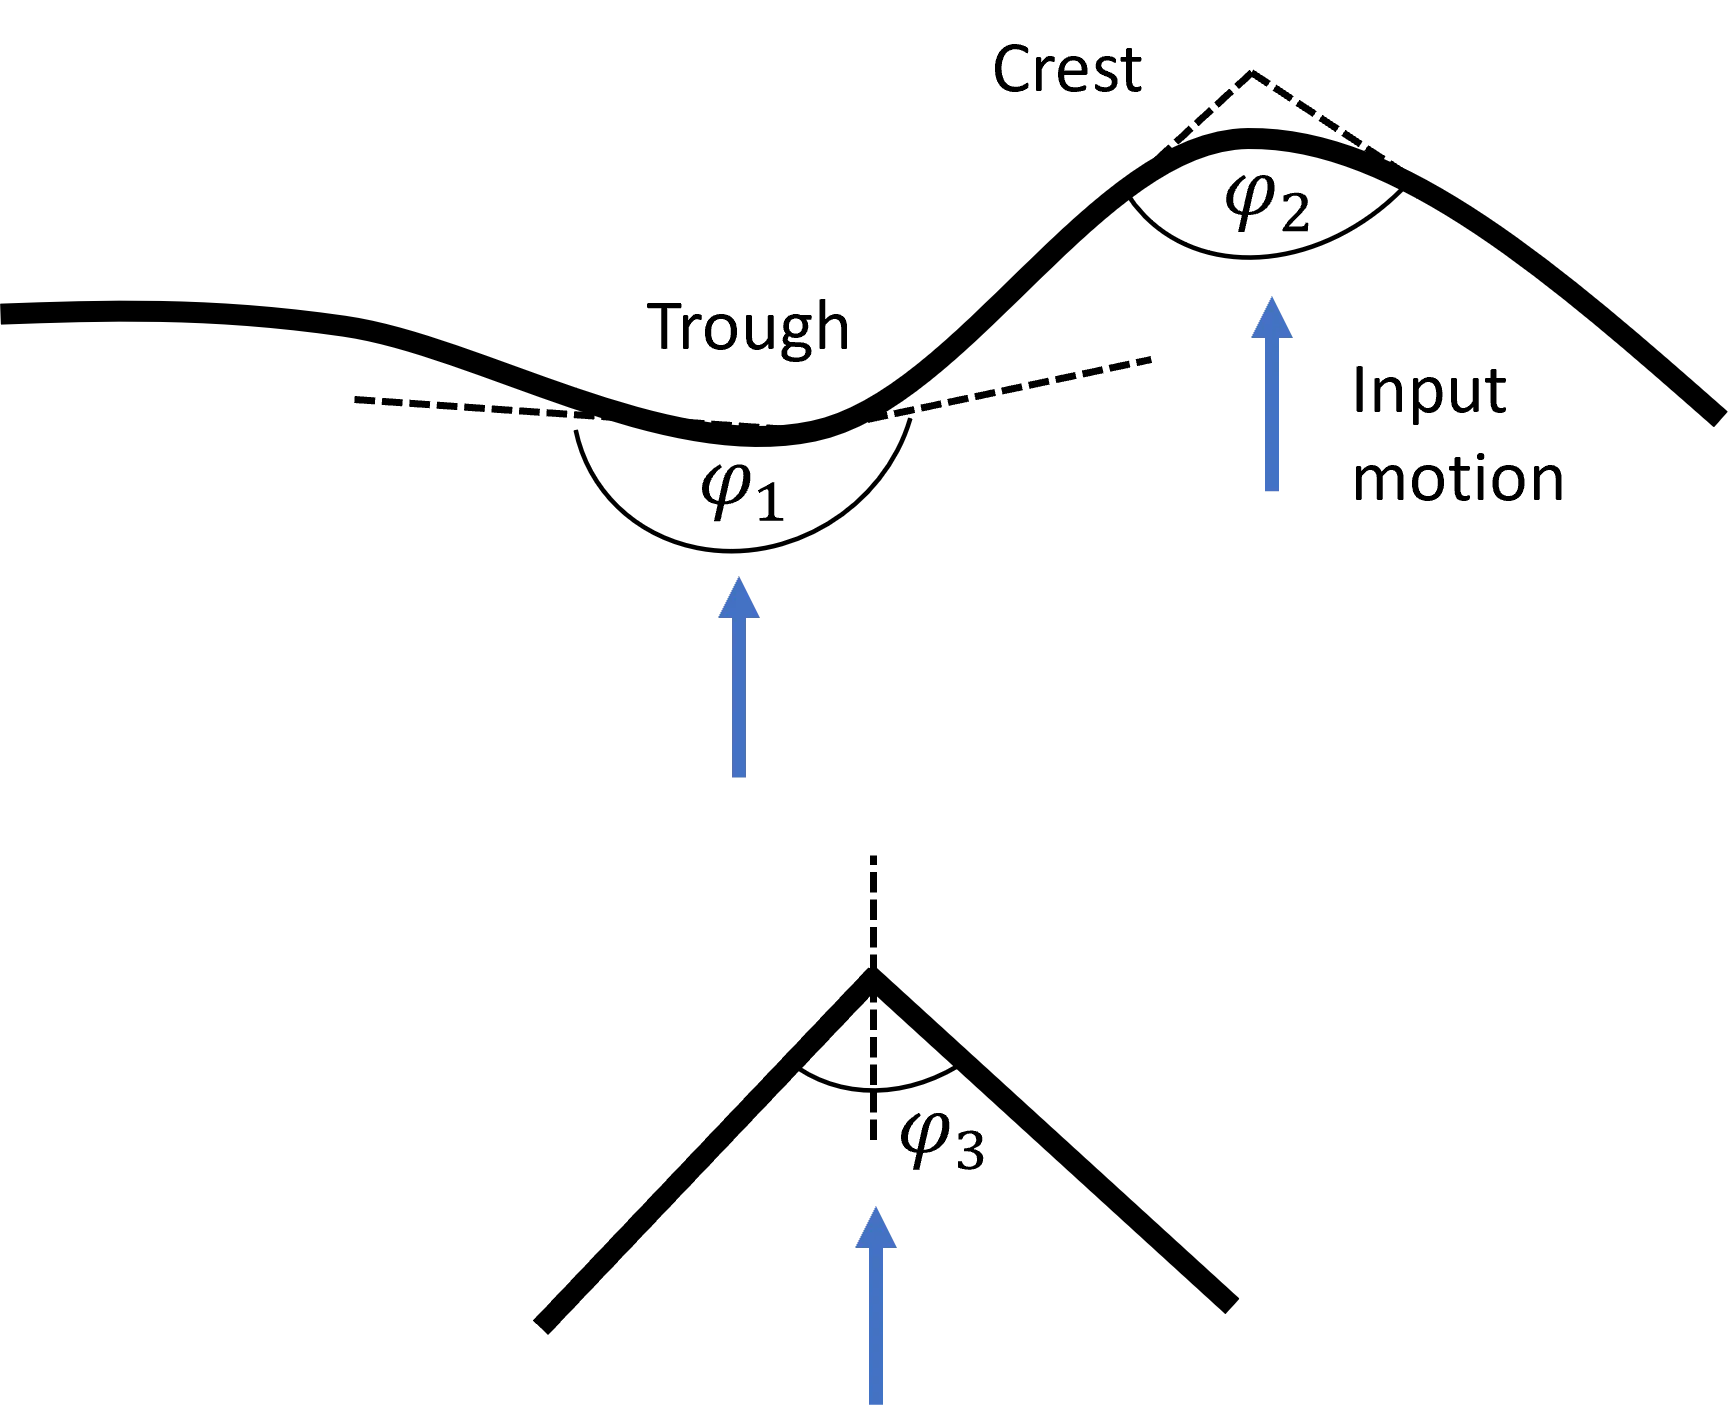 Topographic effects caused by simple irregularities can amplify the ground motion. For example a triangular infinite wedge subjected to vertically propagating S-waves with φ, the angle of the wedge (S. L. Kramer, Geotechnical Earthquake Engineering)
How can we estimate site effects?
The first thing that comes to mind is: “Can site effects be predicted ?” The answer comes from a scientific paper published by David M. Boore (2004), CAN SITE RESPONSE BE PREDICTED ?:
“it depends. It depends on what kind of site response is being predicted and what accuracy is needed in the prediction. The main message of this paper is that variability in ground motions is large, making it difficult to predict site-specific, earthquake-specific site response accurately. On the other hand predictions of mean amplifications for many events and a group of sites sharing somewhat similar geologic conditions can be done with some accuracy. Common to any site response is a reference condition: Site response is always relative to something.”
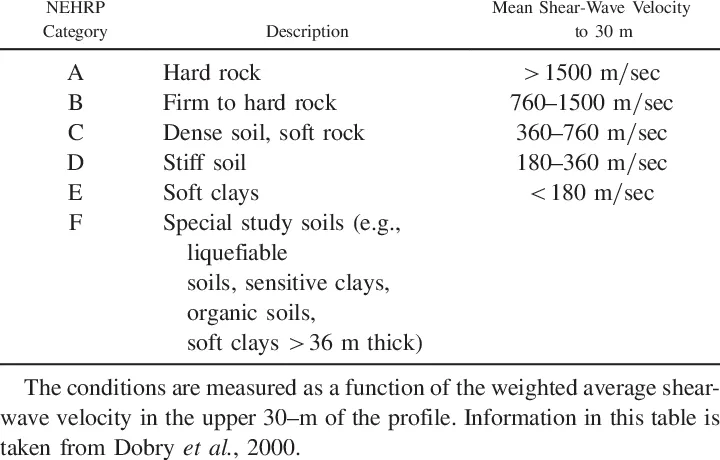
Despite this, various methods exist for estimating site effects, with one of the simplest being the categorization of sites based on soil type. In the past decade, earthquake regulations have increasingly shifted towards using the Vs30 value (the time-averaged shear wave velocity over the top 30 meters) as a basis for site classification (Vs30 Site Classification for Seismic Site Response, NEHPR 1994).
However, the effectiveness of using Vs30 as the sole proxy for assessing site effects has been questioned in several studies. These studies propose the consideration of complementary or alternative parameters. For instance, some investigations explore the utilization of the fundamental frequency (f0) of the site, as an alternative or supplementary indicator alongside Vs30 (Cadet et al. 2012, Luzi et al. 2011). This highlights the insufficiency of relying solely on Vs30 as a single proxy for site-response assessment. Other researchers recommend a combined approach, where the peak amplification frequency (fpeak) is integrated with Vs30 to enhance the accuracy of site response predictions (Baram et al. 2020, Hassani and Atkinson, 2016). Additionally, some studies suggest that a pair of variables, the average shear wave velocity, Vs,z over the top z meters and the site fundamental frequency (f0) offer the best discrimination of soil characteristics (Cadet et al. 2008). These variables are independent and provide a comprehensive representation of different aspects of soil response. Vs30 pertains to the average response within the first 30 meters, while f0 combines information about soil stiffness and the depth to bedrock.
An alternative empirical approach involves the direct extraction of site amplification factors in the frequency domain from observed seismic records. Given that observed ground motion reflects the combined influences of the seismic source, propagation path, and site-specific characteristics, a methodology is necessary to separate and analyze the site effects inherent in the data.
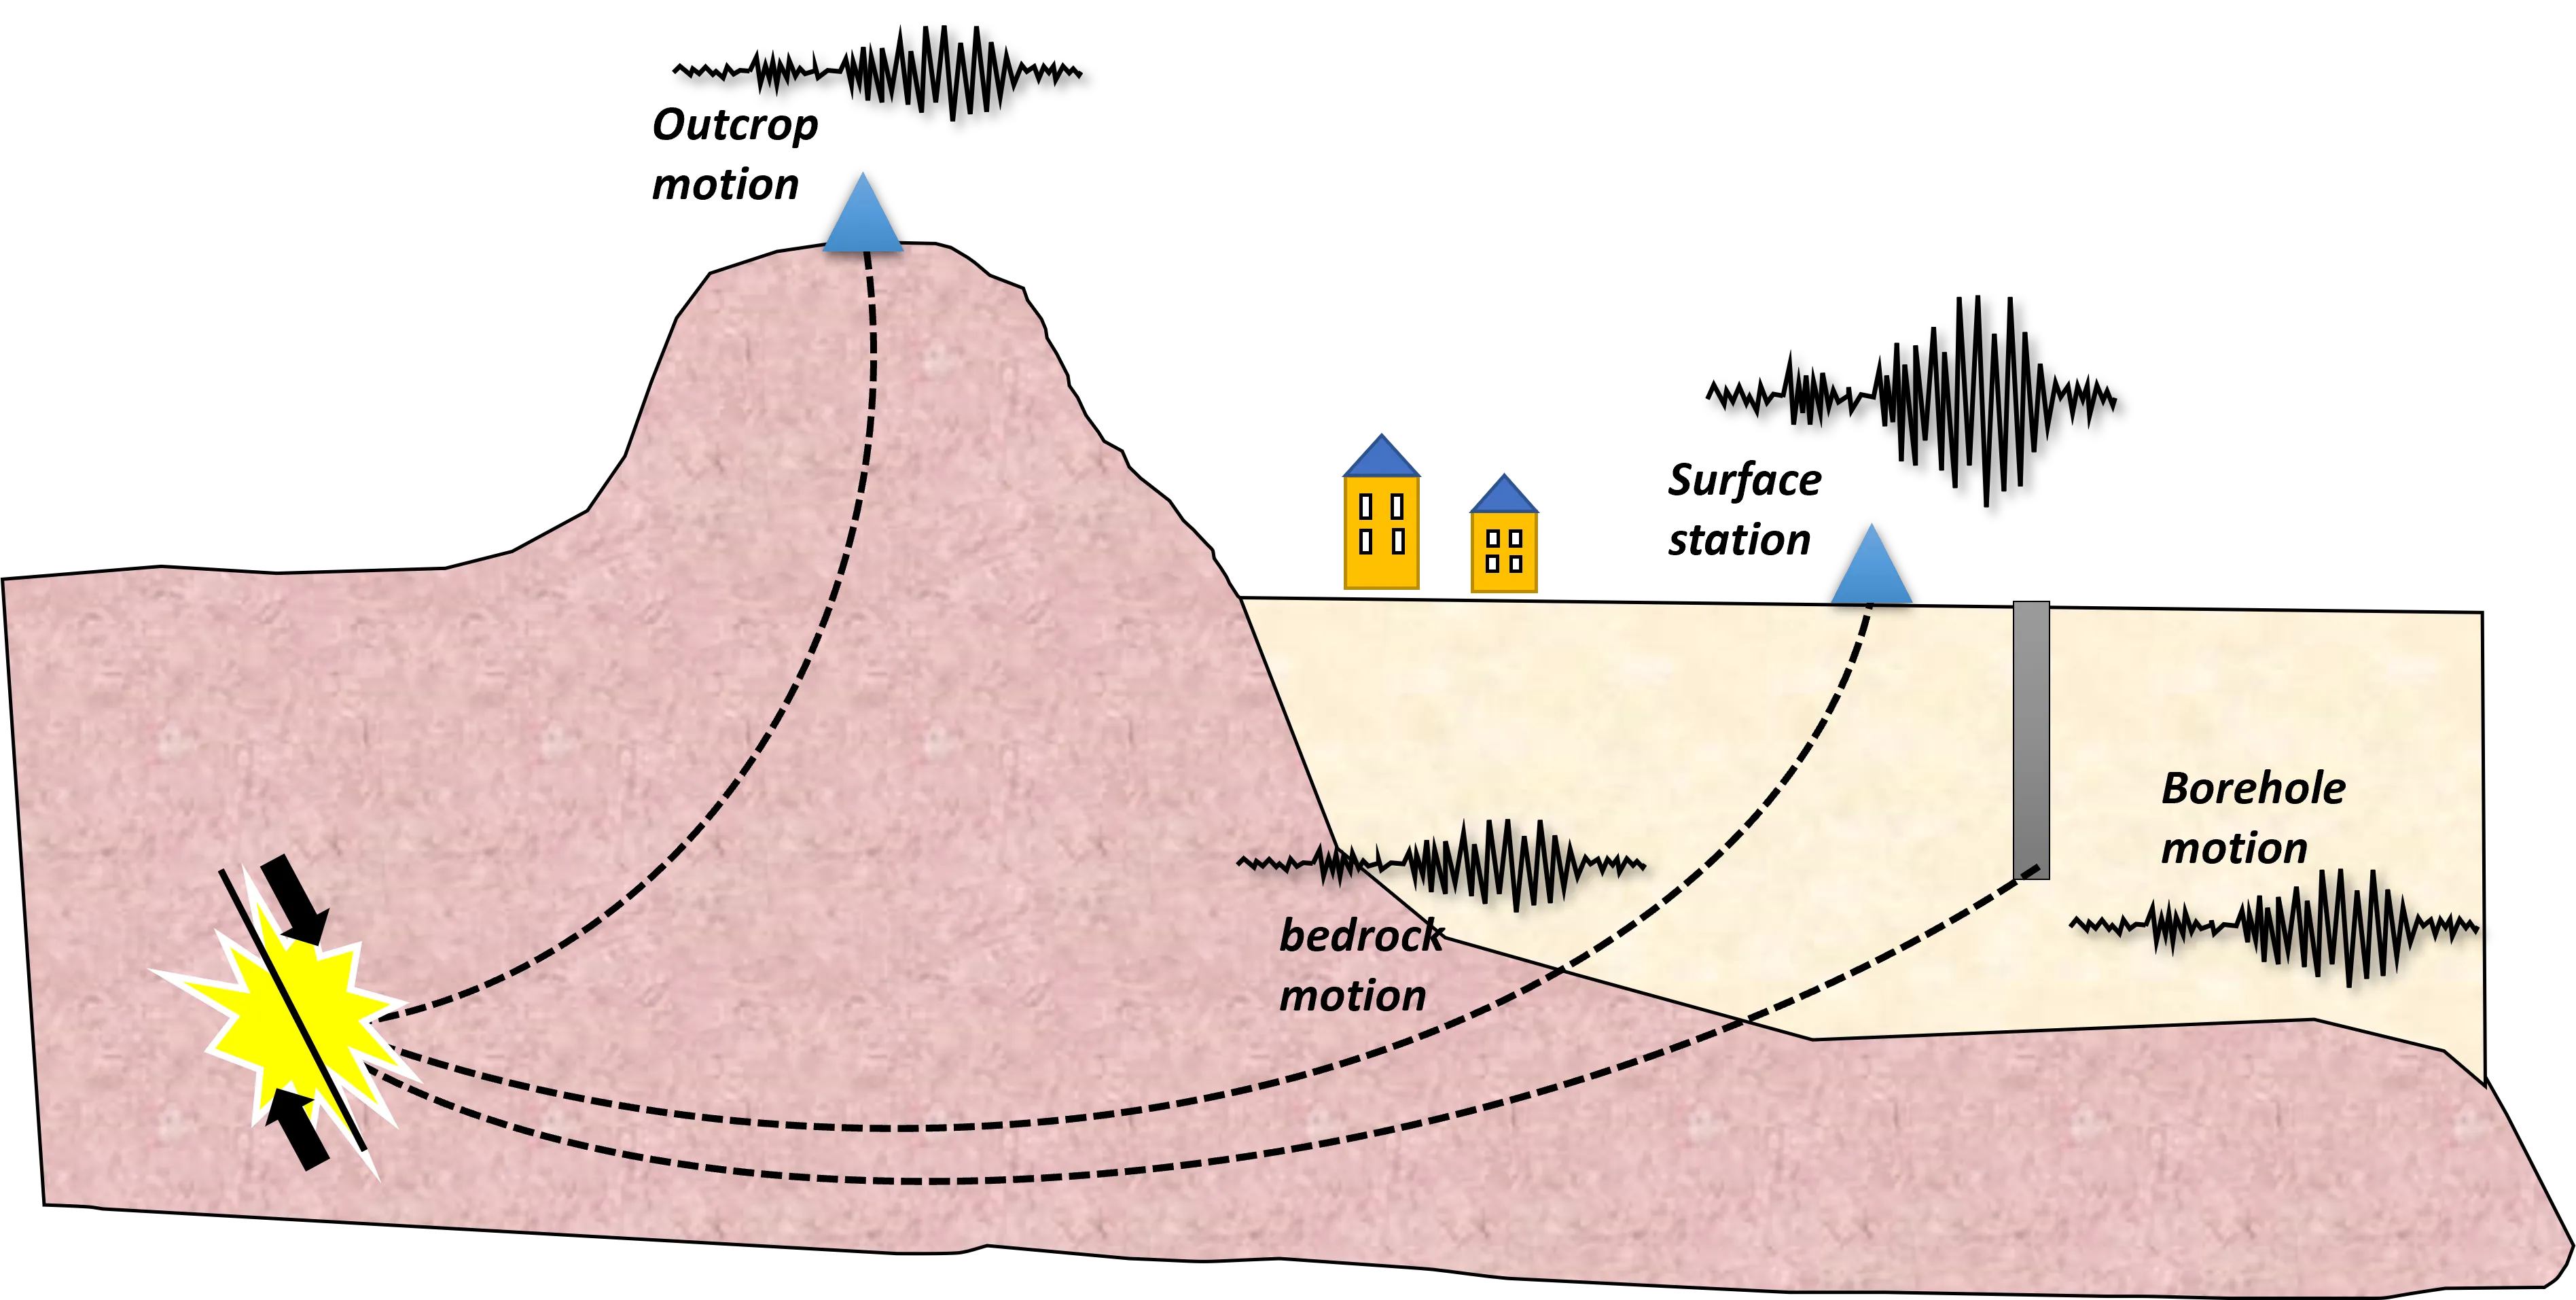
A straightforward yet effective strategy involves computing spectral ratios between two adjacent records obtained from locations with different soil conditions. Ideally, this involves a comparison between a free-field site (no amplification) situated on unaltered hard rock outcrops and a site resting on soft sedimentary layers. site effect motions in surface and in the bedrock
Seismic records at different locations at a site Seismic records at different locations at a site. We can observe the bedrock motion that has no amplification, the surface site motion with increased record amplitude, the outcrop motion with little amplification and the borehole recording with some amplification.
However, in practice, it’s often challenging to identify a completely site-effect-free reference location due to topographical irregularities around the site or the presence of weathered layers beneath it, both of which can introduce substantial site effects. Moreover, a reference site that is entirely unaffected by site amplifications may be geographically distant from the target site. To overcome these limitations, the installation of borehole stations directly beneath surface stations allows for the observation of wave propagation phenomena between these points. It’s worth noting, though, that the seismic data acquired from a borehole, even within bedrock, differs from the motion observed at a surface outcrop. Borehole stations capture both incident waves propagating upwards from below and reflected waves traveling back from the surface. Additionally, it’s important to acknowledge that borehole measurements can be considerably more expensive to implement compared to surface-based monitoring approaches.
A recent innovative approach to assess site characteristics involves calculating ratios of horizontal to vertical components, often referred to as H/V ratios. These ratios can be computed using two distinct methods: the horizontal to vertical spectral ratios of earthquake recordings (eHVSR) and the horizontal to vertical spectral ratio of microtremors (mHVSR). Given that the primary ground motion impact usually arises from the horizontal component, estimating the horizontal site amplification factor (HSAF) is crucial for evaluating site effects. However, these methods introduce several noteworthy issues:
- Equality of eHVSR and mHVSR: There’s a question about whether eHVSR and mHVSR are equivalent. Researchers suggests that while they share similarities, they are not identical. Researchers have computed a ratio known as EMR (Earthquake to Microtremor Ratio) to extract eHVSR information from mHVSR data (Kawase et al. 2018).
- Relationship between HSAF and eHVSR: It’s also important to consider whether HSAF and eHVSR are the same. These may not be identical, but they can be made equal by adjusting the vertical site amplification factor (VSAF) in the denominator of the eHVSR calculation (Ito et al. 2020, Maragkakis et al. 2021).
In summary, recent developments in seismic analysis techniques have led to the use of H/V ratios derived from earthquake recordings and microtremors to estimate site characteristics. However, researchers have found that these methods are not straightforward and may require adjustments or ratios to accurately capture the specific site amplification effects.
H/V ratios from earthquake recordings (eHVSRs)
While we’ve previously mentioned Horizontal to Vertical spectral ratios (eHVSRs), their significance warrants a dedicated chapter to provide a more comprehensive understanding of this approach. This separate chapter will offer a more detailed exploration of this critical concept.
In 2020, Ito and their team introduced an innovative approach, building upon the diffuse field assumption (DFA) previously developed by Wesley (1982), as well as the work of Sánchez-Sesma et al. 2008, 2011, and Kawase et al. 2011. This approach aimed to calculate the horizontal site amplification factor (HSAF) by utilizing the horizontal-to-vertical spectral ratios derived from earthquake recordings (eHVSRs) in combination with a correction factor known as the Vertical Amplification Correction Factor (VACF). The function represented by VACF serves to adjust the eHVSR recordings by eliminating the Vertical Site Amplification Factor (VSAF) from the denominator of these recordings. This correction process transforms the corrected eHVSR into an equivalent representation of the horizontal amplification factor, HSAF.
HSAF = eHVSR x VACF
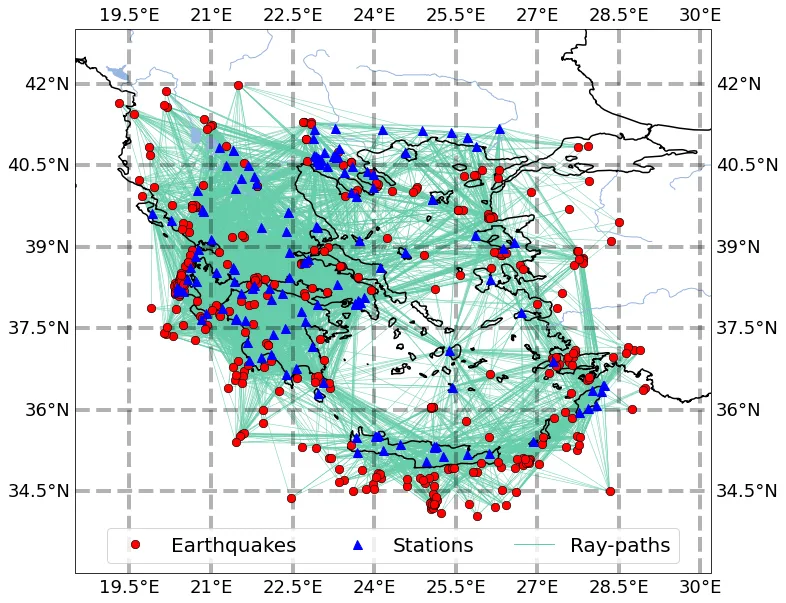
This method simplifies the calculation of the horizontal site amplification factor (HSAF) by multiplying two key components: the horizontal to vertical spectra ratio of earthquake recordings (eHVSR) and the vertical amplification correction function (VACF). Eri Ito (2020) and their colleagues applied this method, in their research paper published in the Bulletin of the Seismological Society of America. Their study aimed to estimate horizontal site amplification factors based on seismic recordings in Japan. Similarly, Maragkakis (2021) and their research team employed the same methodology to compute horizontal amplification factors using recorded data from the Greek region as shown in the ray paths map below.
 Ray paths of the Greek data (earthquakes and stations) used for the analysis with hypocentral distances less that 300 km. The stations are depicted in the map as the blue triangles shown and the earthquakes by the red dots. There were 368 earthquakes recorded by 152 stations and resulted a total of 8428 recordings.
The resulting amplification curves are visually represented in the figures below. The first figure illustrates a comparison between the average VACF curves for Japanese (blue) and Greek (black) data, along with their respective standard deviations. Meanwhile, the second figure displays various VACF curves for the Greek region, categorized based on the fundamental frequency (f0) and the peak HVSR curve amplitude of each station.
 Mean VACF curves of the Japanese (blue curve) and the Greek (black curve) data and their respective standard deviations
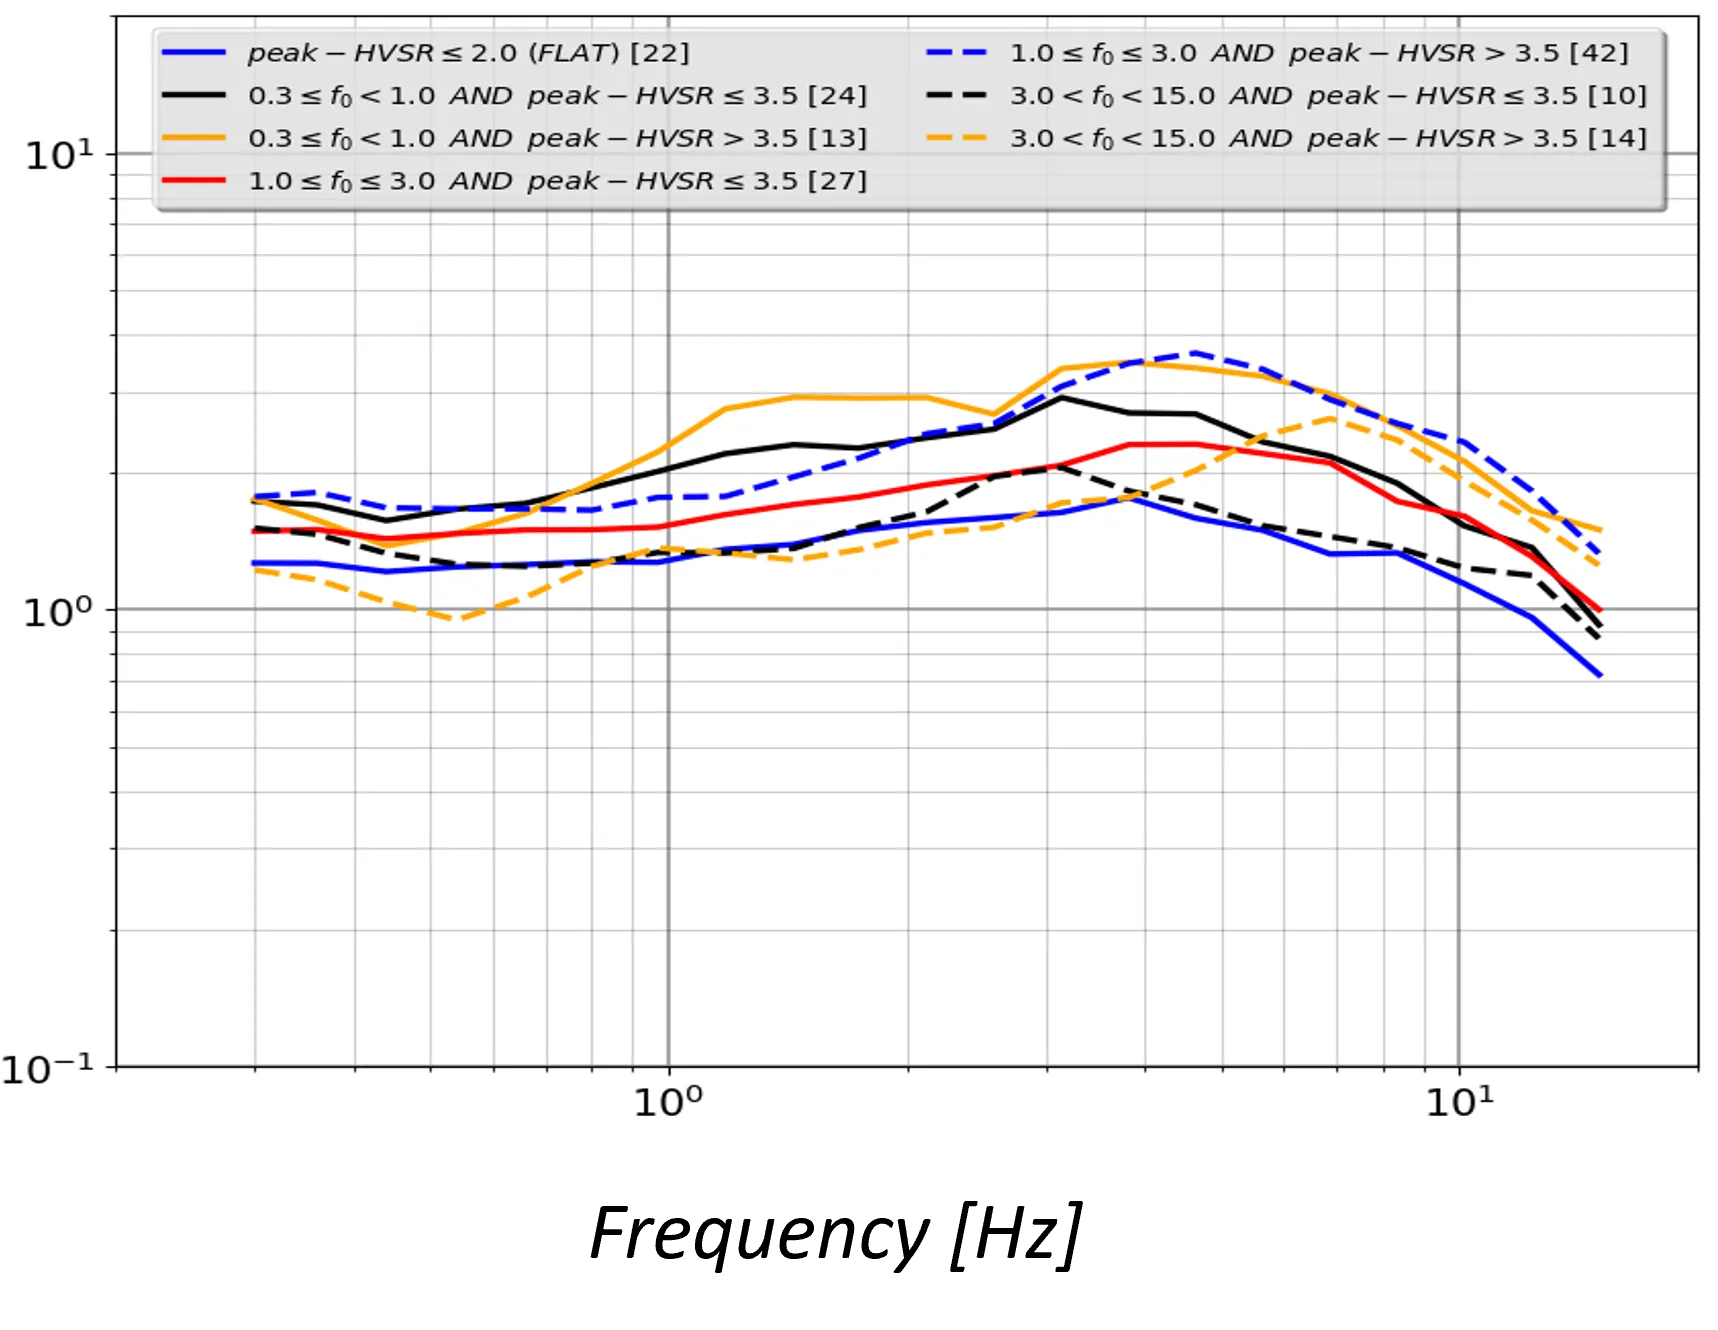 VACF curves for the Greek area categorized by the station HVSR peak amplitude and the fundamental frequency, f0. The numbers inside the brackets are the total stations used for each category.
The final section of this study is focused on validating the outcomes, particularly examining the feasibility of simulating horizontal spectral amplification in locations where the average spectral ratio eHVSR has been derived solely from earthquake records. Subsequently, these calculated values are compared with the horizontal spectral amplification factor determined using an independent method, such as the classical SSR spectral ratio. This comparison serves as a critical assessment to verify the reliability of the study’s results. An illustrative example of this comparative analysis is conducted on the STC and STE stations located in Greece, and the outcomes of this comparison are presented in the figures below.
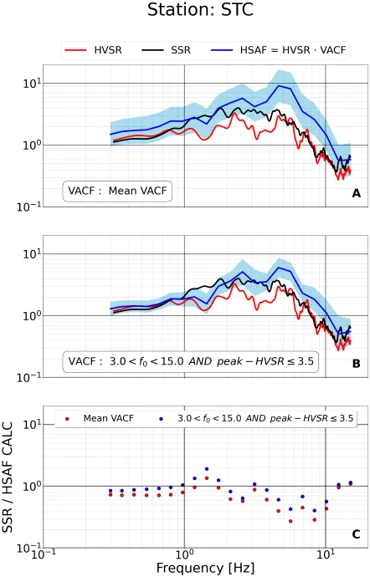 Comparison of the corrected amplification curve (blue curve) with the SSR (black curve) using the average VACF curve (figure A) and the respective categorized VACF curve (figure B) at STC station. The red curve shows the Horizontal to Vertical Fourier Spectra ratio eHVSR. In the figure C, is depicted the ratio of the SSR parameter and the corrected curve that occurs from the average VACF (red points) and the categorized VACF curve (blue points) versus frequency.
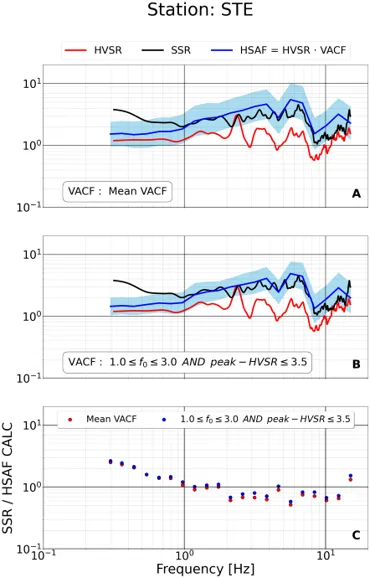 Comparison of the corrected amplification curve (blue curve) with the SSR (black curve) using the average VACF curve (figure A) and the respective categorized VACF curve (figure B) at STE station. The red curve shows the Horizontal to Vertical Fourier Spectra ratio eHVSR. In the figure C, is depicted the ratio of the SSR parameter and the corrected curve that occurs from the average VACF (red points) and the categorized VACF curve (blue points) versus frequency.
When we compare the blue and black lines at these stations, it becomes evident that both corrected curves using the average and the categorized VACF, can simulate the amplification at an extend. However, it is obvious that the application of the categorized correction curve leads to a notably improved estimation across the entire frequency spectrum. Bibliography
- Ito, E. et al. (2020) “A Method to Directly Estimate S -Wave Site Amplification Factor from Horizontal-to-Vertical Spectral Ratio of Earthquakes (eHVSRs),” Bulletin of the Seismological Society of America, 110(6), pp. 2892–2911. doi:10.1785/0120190315.
- Kawase, H., Mori, Y. and Nagashima, F. (2018) “Difference of horizontal-to-vertical spectral ratios of observed earthquakes and microtremors and its application to S-wave velocity inversion based on the diffuse field concept,” Earth, Planets and Space, 70(1), p. 1. doi:10.1186/s40623-017-0766-4.
- Luzi, L. et al. (2011) “Proposal for a soil classification based on parameters alternative or complementary to Vs,30,” Bulletin of Earthquake Engineering, 9(6), pp. 1877–1898. doi:10.1007/s10518-011-9274-2.
- Nagashima, F., Kawase, H. and Matsushima, S. (2017) “ESTIMATION OF HORIZONTAL SEISMIC BEDROCK MOTION FROM VERTICAL SURFACE MOTION BASED ON HORIZONTAL-TO-VERTICAL SPECTRAL RATIOS OF EARTHQUAKE MOTIONS,” in
- BOORE, D.M. (2004) “CAN SITE RESPONSE BE PREDICTED?,” Journal of Earthquake Engineering, 8(sup001), pp. 1–41. doi:10.1080/13632460409350520.
- Baram, A., Yagoda-Biran, G. and Kamai, R. (2020) “Evaluating Proxy-Based Site Response in Israel,” Bulletin of the Seismological Society of America, 110(6), pp. 2953–2966. doi:10.1785/0120200140.